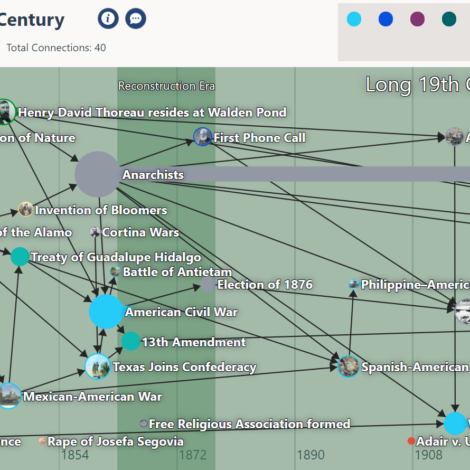
ClioVis creator, Dr. Erika Bsumek, an associate professor at UT-Austin, recently joined us on campus to lead a workshop on using ClioVis, an interactive digital timeline tool. Like TimelineJS and other digital timeline tools, you can plot points on a timeline, create summaries of those items, and attach images to them. ClioVis goes above and beyond these other tools in a few big ways: it’s much more interactive and allows users to create connections between items the interface is very easy to use it’s easy for students to collaborate in groups. It’s clear that Bsumek is passionate about pedagogy and
Small Changes, Big Impact
I’ve long been a huge fan of James Lang‘s since I read his book Small Teaching in a book group a few years ago. He calls us to make small changes to our teaching, one change at a time, rather than feeling obligated to overturn our syllabi and start anew. This practical approach of learning tools and tricks that I can implement immediately at any point in the semester has been fundamental to my thinking about pedagogy. Lang regularly writes for The Chronicle, and one of my favorite pieces is “Small Changes in Teaching: Making Connections.” In this piece, Lang articulates the
Infographics
As we are inundated with data via infographics and other visualizations, it is essential that students learn to read and analyze these types of visual communication. Analyzing sample infographics in your field and introducing students to Randy Olsen’s “Infographics Lie. Here’s How To Spot The B.S” can help students critically engage with these types of visualizations while developing important visual literacy skills. I love using assignments that ask students create real world products, not only because it provides them the opportunity to develop valuable life skills, but also because it allows them to communicate with audiences beyond our classroom. Asking students


